How to find out if your content creation is working
Entrepreneurs, business owners, influencers - we all create a lot of content, right? We all create in order to inform and educate our audience on what we do and how they can improve their lives in some way shape or form.
But, how do we know if our content creation is actually working? How do you know what content to create and what your audience loved to consume? I have one thing to tell you…
It is ALL in the numbers.
It might sound a bit gross right? But no, seriously it is will you help you a LOT - and doesn’t have to be over complicated either. Let me take you through the very easy ways you can track if your content is working.
If you find value in this blog, make sure you share it with me on LinkedIn, Facebook or Instagram! Even better, share it with your audience! You can also listen to the episode below!
Before we get stuck in, we want you to remember, these are high level statistics. Of course, once you learn more about the numbers, you should be diving in a little deeper (or have someone to do it for you). These statistics are super powerful and will tell you a lot about your content and marketing.
Listen below!
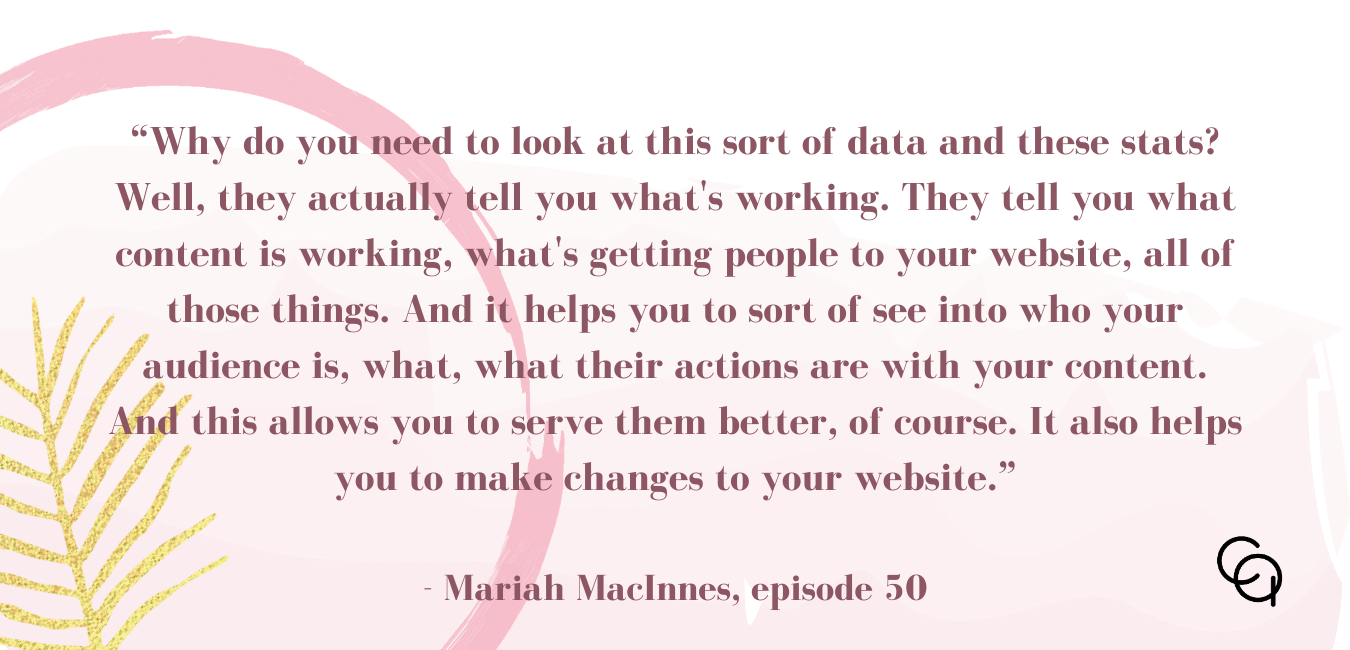
Why should you look at the statistics for your content?
We trust you know why you need to look at data and statistics for anything in your business, but in case you don’t - it tells a story. It will also tell you a lot of things like:
What content is working
More about your audience and their behaviours, likes and dislikes
What edits you need to make to your website (see more on this here)
How to create more of the content your audience loves
Plus you know what?
It saves you time! Why would you spend time creating something that doesn’t work? So if you know it doesn’t work, you spend less time working on it!
So, how do you measure your content success on social media or your other content platforms? Let’s check it all out!
Looking at the numbers
Google Analytics
When it comes to Google Analytics, you need to remember the number one objective of creating your content on your social media accounts, podcasts, videos and the like.
You want to get people to your website!!!
Why, because that is where they buy from you! That is where you can help them.
Of course, every piece of content has different objectives, but you really do want people to your site!!
So what are some of the things you want to look at with the numbers/data?
Users
New Users
Sessions
Number of pages visited per person
Number of sessions per person
Bounce rate - the percentage of visitors who have come to your site and have left before going to other pages
The place people landed on your site from (this is called referrals and will tell you what social media channels are working for you)
What pages they looked at (also is good for tracking launches)
You can go VERY deep with this and look at more demographics and you can track certain places on your site. But for now, let’s go basic!
If you want to learn more about Google Analytics, they have a great range of courses!
With Instagram, the insights on the platform are a little tricky, which means you might have to track them weekly (they only run off a 7 day outlay and can’t be backtracked without a third party app like Share My Insights or Hootsuite).
Here is what you want to look at:
Reach
Impressions
Engagement
Bio clicks
Profile views
You can also dive in and look at the demographics as well! It will even tell you what time of day your audience is most active!
Then of course, monthly (weekly or even daily) you can look at the posts you have created and dive into each post's insights. But you can also look at the monthly overview and track the best rank posts from:
Saves
Comments
Shares
Follows
Visits to profile
Visits to website
These are the great stats to look at as a guide! Plus if you are unsure what things like “reach and impressions” mean, the insights on the platform give good information on this to help you understand!
If you use Facebook heavily, you might want to check this weekly, otherwise, you can do it monthly.
The things you want to look for include:
Actions taken from your page
Views
Page likes
But you also want to go into the individual content (at the bottom of the stats overview page) and look at the reach and engagement for each post. This will give you great insight into what content people like!
Now, if you are using a personal profile, LinkedIn doesn't have analytics for your personal account (not yet anyway), so it really is only about checking the vanity metrics (likes, views, comments).
However, you can use your Google Analytics to see if people are coming to your site based on posts where you have asked for people to go to your website. Of course, you will have to monitor it straight after you post. Otherwise, you can just see how many people come from LinkedIn in general.
Of course, a business page has more analytics but you will see less engagement.
YouTube
For YouTube, you want to look at a few high level stats, but of course, each video has their own statistics to go with it.
Look at the whole picture, then dive into the videos and look for:
Subscribers
Click through rate (will tell you if your thumbnail is working)
Duration of the video watched (and average duration)
Content likes, comments and views
Email Marketing
When it comes to your email marketing, you really just want to look at the open rate of your email (this allows you to edit your subject lines) and your click-through rate (how many links in your email were clicked).
Don’t be hard on yourself if they seem low, check out these averages:
If you want to learn more about the power of email marketing, check out this podcast episode of Anna Rogan (email marketing queen)
Podcast
Then your podcast (poddy), when it comes to your podcast, of course, you want to look at your views per episode and your estimated audience amount.
With your podcast views, you can gauge the topics and format people like with your show!
The other things you would want to look at in your demographics! If you have a podcast host site like Anchor, you will get great stats with it! Also, Chartable is a great site to track reviews and rankings on the charts!
How often should I track?
So the million dollar question is “how often should I track my insights, analytics, stats - whatever?” Well, my recommendation? For your most popular channels, weekly (also Google Analytics weekly).
But, if you can’t manage that, try and do it at least once a month to see how things are tracking. If you push it out longer, you are missing out on very important bits of information! Try and make it a habit and set it as a task on your admin days!
How should I track?
You want to record these numbers so you can reflect on them! The most important thing is, you reflect on them and make changes based on the statistics and the data!
You can record them in a way that works for you, but even a Google Sheet will work wonders!! You can purchase my measure guide and get a free auditing template with it!!
Just remember, record it and reflect on it!
Final thoughts
Are you ready to tackle the numbers and data now?
Here is what you need to do!
Track your website stats on Google Analytics
Track your social media insights (pick your platform)
Track your other content platforms
Do this as often as you can (the more the better)
Note the numbers and data down
Always reflect on it to make the changes you need to make
Once you start using the numbers, you will know what your audience likes and you will be able to serve them a lot better!
If you found value in this blog, make sure you share it with me on LinkedIn, Facebook or Instagram! Even better, share it with your audience! You can also listen to the episode below!


